Fixture Recovery Patterns Offer Insights into Performance Trends Across Competitive Seasons
Morgan Griffin · Jul 1, 2026
Fixture Recovery Patterns Offer Insights into Performance Trends Across Competitive Seasons
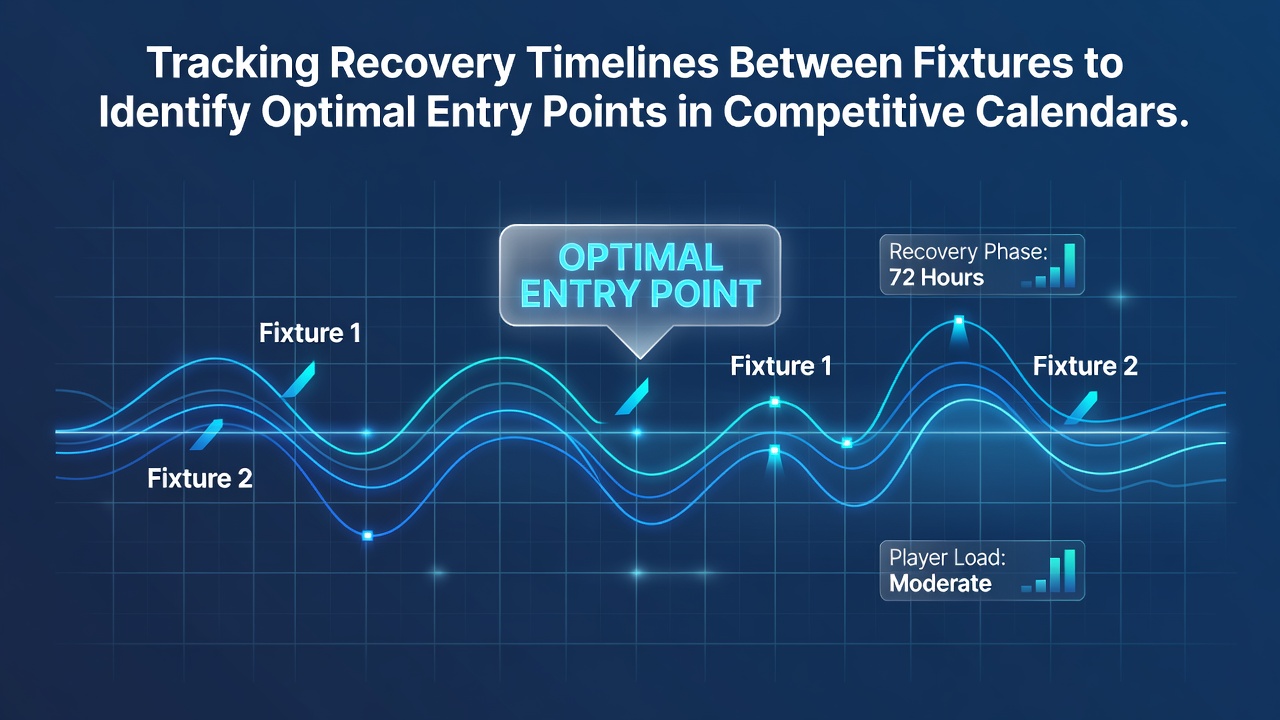
Competitive calendars in major sports leagues pack multiple fixtures into tight windows, and recovery timelines between those events shape measurable outcomes in performance metrics. Observers note that teams and athletes with shorter rest periods often show declines in key indicators such as sprint speed, shooting accuracy, and defensive positioning. Data collected from soccer, basketball, and tennis circuits during the 2025-2026 seasons illustrates consistent patterns where extended gaps of five or more days correlate with higher win percentages for squads returning from congested schedules.
Leagues publish fixture lists well in advance, yet the real work lies in cross-referencing those dates with injury reports and travel logs. Researchers at institutions tracking athlete workloads have compiled datasets that link rest duration directly to statistical outputs. For instance, basketball teams averaging under 48 hours between games record lower three-point percentages according to aggregated league statistics released in early 2026.
Core Elements of Timeline Tracking
Analysts break recovery timelines into distinct phases that include travel recovery, physical rehabilitation, and mental reset periods. Each phase carries its own data points pulled from wearable technology, GPS tracking, and medical evaluations. Organizations such as the Australian Institute of Sport publish guidelines that quantify minimum rest thresholds for elite competitors, and these benchmarks appear in performance reviews circulated among betting markets and coaching staffs alike.
July 2026 schedules already released for several European soccer leagues and North American basketball circuits highlight clusters of midweek fixtures separated by as little as two days. Those compressed windows create measurable drops in high-intensity running distance, figures that surface in post-match reports issued by governing bodies.
Data Sources and Integration Methods
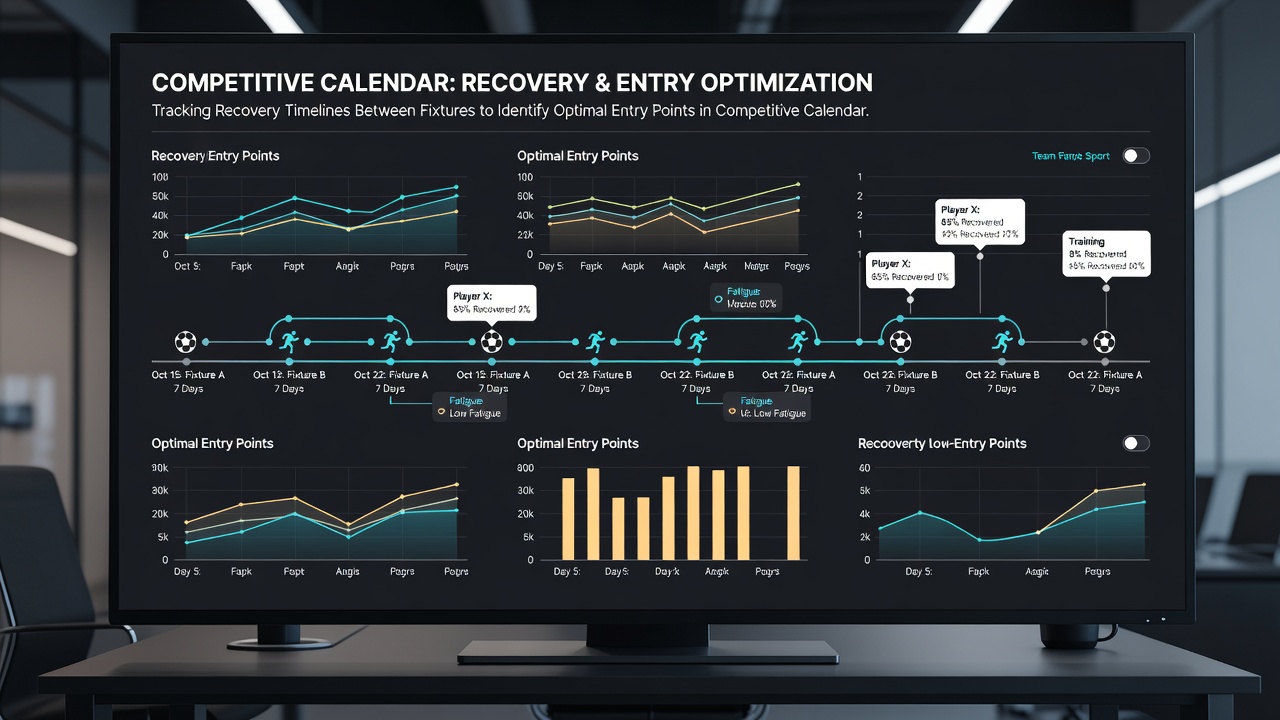
Publicly available datasets from league offices, combined with academic studies on neuromuscular fatigue, allow systematic mapping of recovery intervals. A 2025 report from the Canadian Sport Institute examined over 1,200 matches across multiple disciplines and found that athletes granted at least 72 hours of recovery time maintained baseline levels of explosive power more reliably than those on shorter cycles. These findings integrate with scheduling software used by professional organizations to flag potential performance variances.
Industry groups such as the Sports Analytics Association compile annual summaries that include rest-day correlations with point differentials and goal tallies. Users of these datasets often overlay them onto fixture calendars to isolate segments where one side enters a match with a documented rest advantage.
Application in Multi-Sport Calendars
Tennis players navigating clay and grass swings during the European summer face rapid surface changes alongside varying recovery windows. Tournament organizers release daily schedules that reveal back-to-back sessions for certain competitors, and performance databases maintained by the International Tennis Federation record corresponding shifts in serve percentages and error rates. Similar patterns emerge in volleyball beach circuits where consecutive match days coincide with measurable fatigue indicators tracked through heart-rate variability logs.
Horse racing calendars present another layer because equine recovery timelines differ from human athletes yet follow comparable logic. Studbooks and racing authorities maintain records of start intervals, and analysts cross-reference those with track conditions to identify races where recent runners may carry residual effects from prior efforts. Data aggregated through the 2026 flat season shows longer gaps between starts aligning with improved finishing positions in several distance categories.
Calendar Compression Effects Observed in 2026
Summer tournament clusters scheduled for July 2026 already list multiple three-game weeks in basketball and soccer. National federations in Europe and Asia publish these blocks months ahead, giving analysts time to model expected recovery shortfalls. Studies conducted by university sports science departments indicate that cumulative load over such periods elevates soft-tissue injury risk by measurable percentages, figures that influence roster availability lists released weekly by clubs.
Cross-league comparisons further refine the picture. North American major-league schedules incorporate designated rest days for travel-heavy teams, while certain international competitions compress timelines further due to qualification windows. Observers tracking both systems report that teams returning from longer-haul trips after short recovery windows display consistent drops in second-half output statistics.
Conclusion
Recovery timeline analysis supplies a factual framework for examining performance variables across packed competitive calendars. Datasets drawn from league reports, academic research, and sports institutes continue to expand, offering clearer correlations between rest intervals and statistical outputs. Those monitoring July 2026 fixtures and beyond gain access to structured information that highlights segments where schedule compression may alter expected results.