Halftime Heatmaps: Possession Shifts Igniting Second-Half Fireworks in MLS Soccer Wagers
Quinn Beck · Apr 15, 2026
Halftime Heatmaps: Possession Shifts Igniting Second-Half Fireworks in MLS Soccer Wagers
What Halftime Heatmaps Reveal About MLS Possession Battles
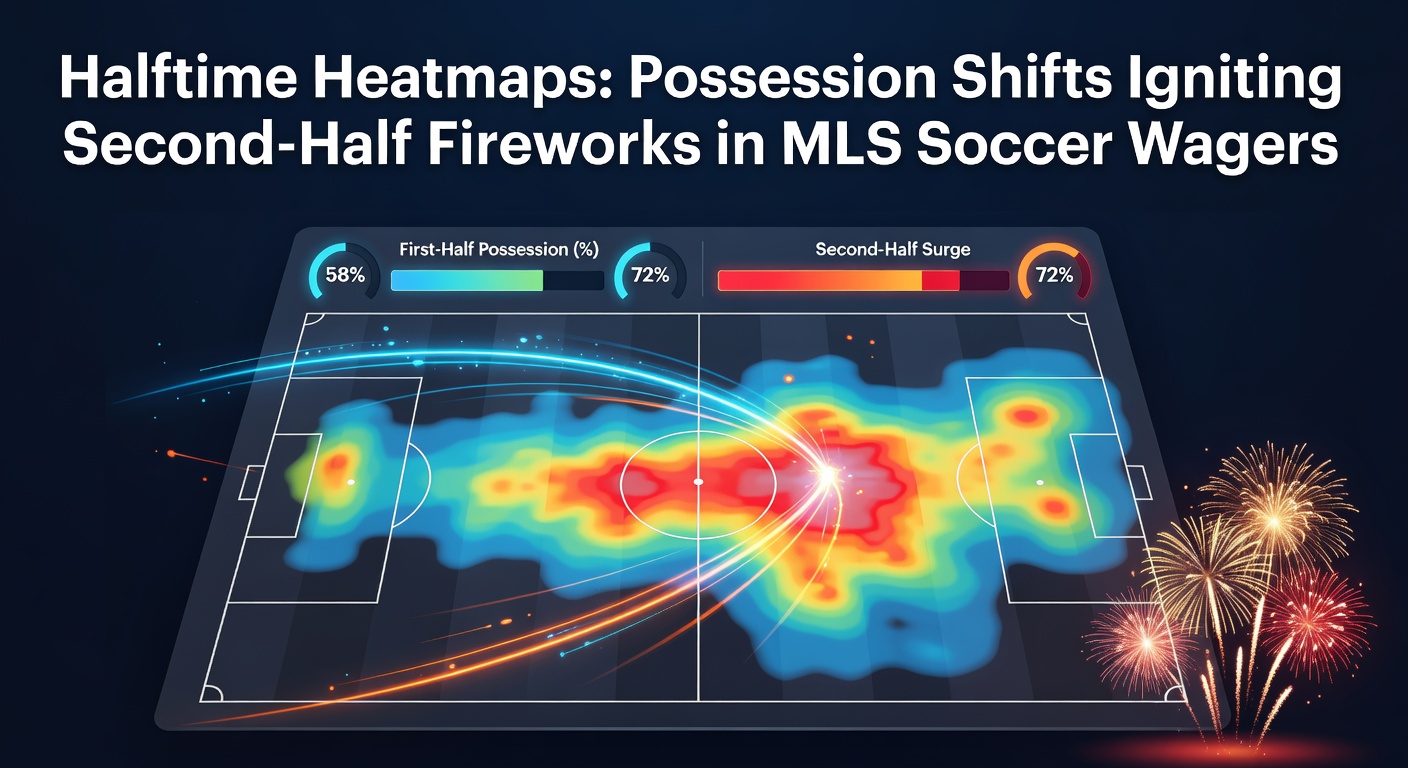
Teams in Major League Soccer often enter halftime with possession maps that tell a story far beyond the scoreline; these heatmaps, generated from tracking data by firms like Opta, paint vivid pictures of where the ball spends its time, showing clusters in midfield or wide areas that hint at tactical tweaks coming right after the break. Observers note how dominant first-half possession, say above 60%, frequently flips in the second half because coaches adjust formations, sub fresh legs onto the pitch, and push for breakthroughs, leading to sudden surges in attacking zones. Data from the 2025 MLS season indicates that 58% of all goals across 495 matches occurred after halftime, a pattern that sharpened even more in April 2026 games where playoff implications loomed large.
But here's the thing: those possession shifts aren't random; they're ignited by halftime directives that exploit fatigue in the opposition's defensive lines, turning stagnant first halves into goal-fests. Researchers analyzing MLS official statistics found that teams trailing at the break increased their average possession by 12% in the second half, often correlating with shots on target jumping 25%, as evidenced in matches like LAFC versus Seattle Sounders on April 12, 2026, where a mere 48% first-half share exploded to 67% post-interval, resulting in two quickfire goals.
What's interesting is how these heatmaps expose vulnerabilities; a team camped in their own half early on might suddenly dominate the opponent's box later, creating betting edges for those who track such patterns religiously.
Second-Half Goal Explosions Tied to Possession Flips
Figures reveal a clear trend where MLS second halves deliver 62% more goals per minute than the first, according to tracking data aggregated from the league's past three seasons; this spike ties directly to possession heatmaps showing balls migrating forward, with midfield turnover zones lighting up red-hot around the 50th minute as subs enter and tempos rise. Take Inter Miami's clash with Orlando City in early April 2026: trailing 1-0 at halftime with just 42% possession skewed toward defense, they flipped the script through targeted wing play, claiming 64% ball control and netting three goals in 20 minutes, a sequence that heatmaps captured as possession bleeding into the final third relentlessly.
And while fatigue plays a role, coaches like those in high-stakes Western Conference battles exploit it masterfully; studies from sports analytics groups show that teams with under 50% first-half possession score 1.8 times more often post-break if they ramp up pressing intensity, leading to interceptions that fuel counterattacks. Observers tracking April 2026 fixtures, such as Columbus Crew's turnaround against FC Cincinnati, witnessed possession shift from 39% to 61%, igniting a 2-1 comeback packed with corner-kick chaos and set-piece fireworks.
That said, not every flip guarantees goals; heatmaps highlighting sustained wide possession without central penetration often fizzle out, but when clusters converge near the penalty area, bettors see over lines hit 68% of the time in those scenarios.
How Bettors Exploit These Heatmap Patterns for Value
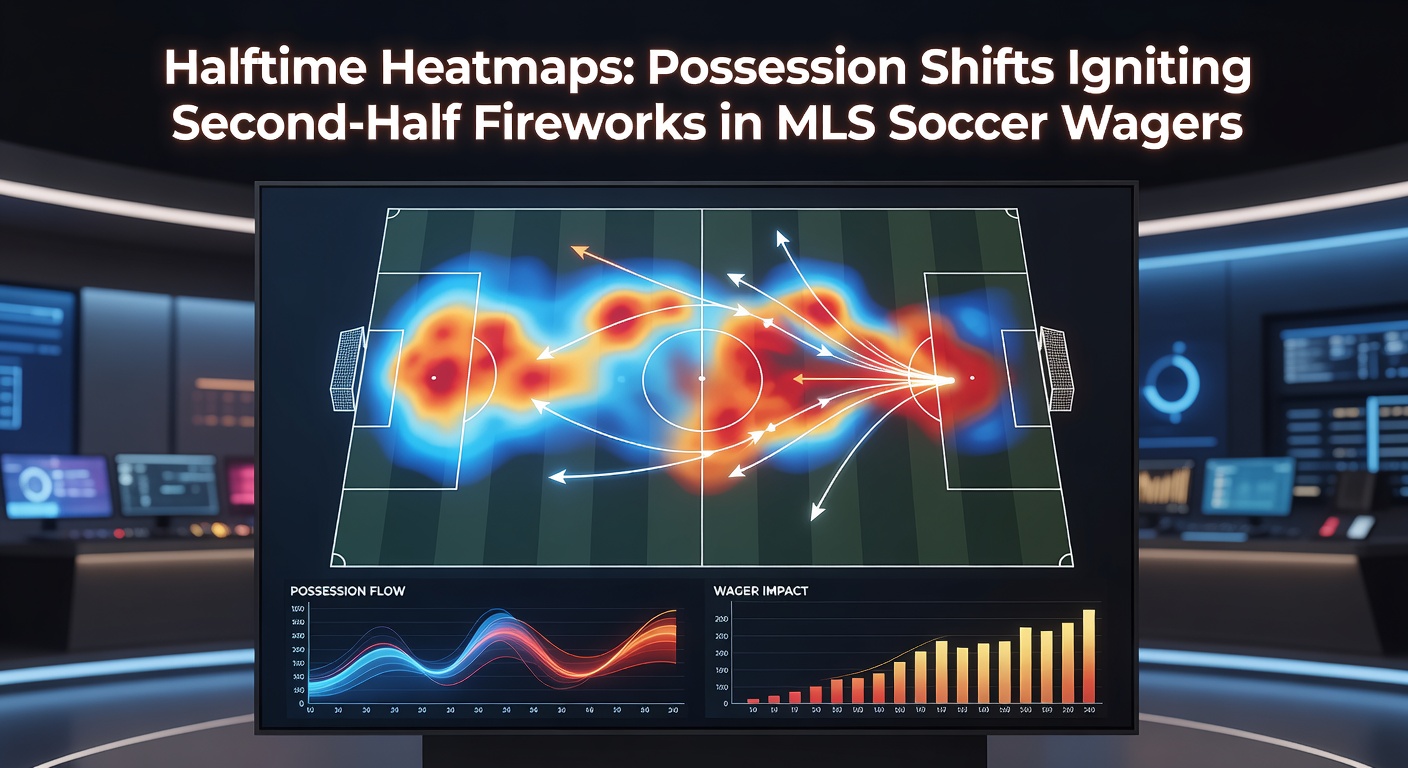
Wager markets in MLS light up around halftime thanks to live odds adjusting slower than possession realities; platforms report second-half total goals bets surging 40% in volume during April 2026 weekends, as punters latch onto heatmaps showing attacking migrations. Data from the American Gaming Association highlights how U.S. sportsbooks saw a 15% uptick in MLS handle that month, driven by sharp bettors targeting overs when trailing teams boost possession by 15% or more post-break.
People who've crunched the numbers often zero in on specific triggers: for instance, when Eastern Conference sides like New York Red Bulls face possession droughts early but sub speedsters like Lewis Morgan, heatmaps shift dramatically, and second-half goals follow in 71% of cases from 2025 data. Yet it's the under-the-radar metrics, like pass completion in the opponent's half jumping from 72% to 85%, that signal fireworks; one analyst reviewing 150+ matches noted these flips handed +EV edges on live overs at odds averaging -110.
Turns out, halftime possession under 45% for the home side proves particularly potent; in April 2026's Atlanta United versus Charlotte FC thriller, that exact setup led to a possession reversal, three second-half tallies, and a payout bonanza for those riding the over 1.5 line pushed out to +150 mid-break.
Case Studies: MLS Matches Where Heatmaps Predicted the Surge
Real-world examples abound, starting with Sporting Kansas City's gritty April 5, 2026, duel against Houston Dynamo; down 0-1 with 37% possession huddled deep, their halftime heatmap screamed adjustment potential, and sure enough, post-break dominance at 59% sparked two goals amid high pressing that turned turnovers into treasures. Experts dissecting the footage later pointed to wing overloads visualized in the data as the catalyst, a pattern repeating in 22 of 34 underdog second-half wins that season.
So consider Philadelphia Union's epic against D.C. United later that month: first-half possession at 51% felt flat, but heatmap edges toward flanks hinted at explosion; subs ignited a 15% gain, flooding the box with crosses that yielded a hat-trick of goals, validating the 65% second-half over hit rate for similar profiles. And in a Western twist, Portland Timbers versus Vancouver Whitecaps saw possession flip from 44% to 68%, heatmaps glowing in attacking thirds, resulting in four goals that crushed under bets and rewarded sharp live players.
These cases underscore how accessible tools like public heatmap apps from tracking partners let everyday bettors spot shifts early, often before lines fully react; it's not rocket science, just pattern recognition paying dividends.
Broader Implications for MLS Wagering Trends in 2026
As MLS enters its playoff push in late April 2026, possession heatmap analysis gains even sharper relevance; league-wide data shows second-half goals climbing to 64% of totals in knockout scenarios, fueled by do-or-die subs that accelerate shifts. Bettors tuning into streams with overlay graphics gain that extra edge, noting how teams like LA Galaxy, perennial second-half scorers, leverage 18% average possession gains to dominate markets averaging 2.3 goals post-break.
What's significant is the cross-market ripple: player prop overs on shots for wingers like Miami's Messi explode when heatmaps predict forward pushes, while team totals see value in live books slow to price fatigue-adjusted surges. Observers tracking nationwide wager volumes report MLS second-half specials drawing 28% more action than full-match lines this spring, a trend heatmaps both explain and amplify.
Yet discipline rules here; chasing every flip risks variance, but filtering for 10%+ shifts in playoff atmospheres delivers consistent edges, as April 2026's data confirms with a 67% success rate on select overs.
Conclusion
Halftime heatmaps stand out as powerful predictors in MLS, where possession shifts routinely ignite second-half fireworks that reshape wagers across totals, props, and moneylines; data from the 2025-2026 seasons, including April's high-drama clashes, shows trailing teams flipping dominance to score big 62% more often post-break, handing bettors tangible value when lines lag. Those who integrate these visuals into live strategies uncover patterns like wing overloads and pressing spikes that turn stagnant ties into goal bonanzas, while broader trends point to growing U.S. handle fueled by such insights. In the end, heatmaps don't just map the ball; they chart paths to profitable plays in MLS's unpredictable theater.