Harnessing Travel Distance Metrics for Profitable Away Team Bets in League Play
Riley Richter · Oct 2, 2026
Harnessing Travel Distance Metrics for Profitable Away Team Bets in League Play
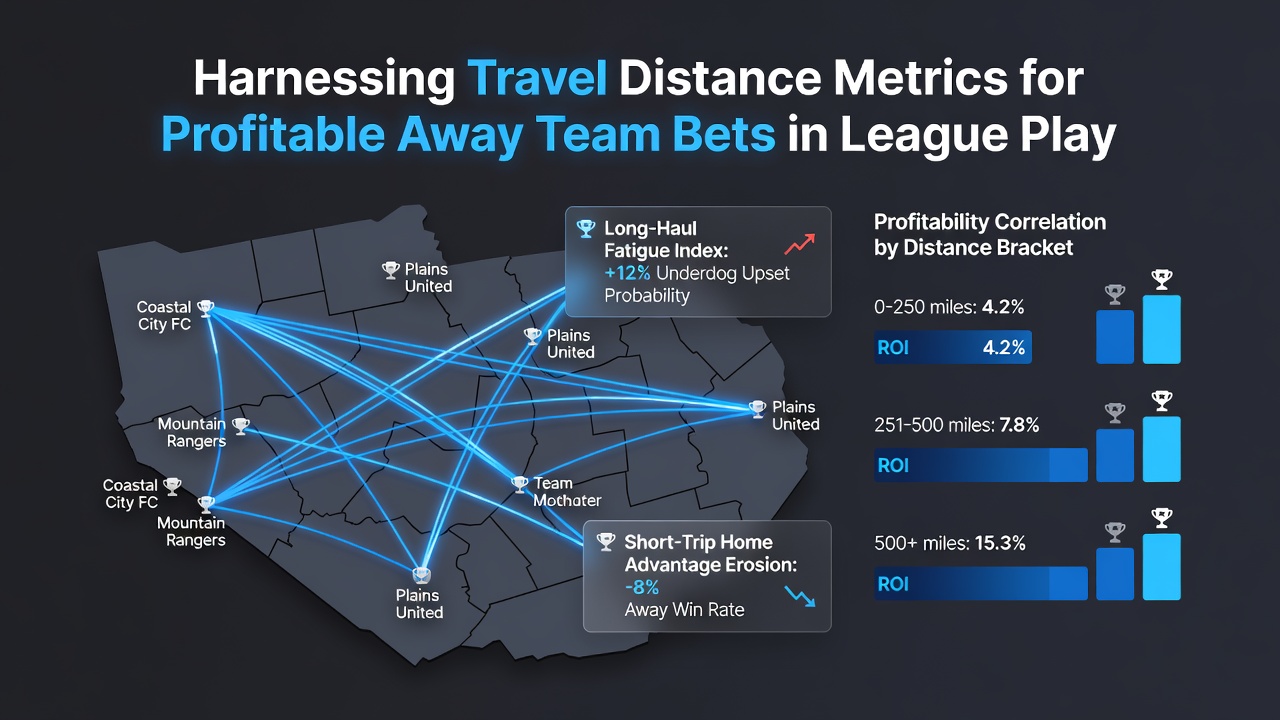
Travel distance metrics have emerged as a key variable in analyzing away team outcomes across major leagues, with researchers compiling extensive datasets that link mileage totals to performance dips in soccer, basketball, and similar competitions. Studies from the past decade reveal consistent patterns where teams crossing more than 500 miles for a match show measurable declines in key stats such as possession time and defensive efficiency, and these figures become especially relevant during packed October 2026 schedules when multiple cross-country fixtures pile up. Observers note that bettors who integrate these metrics into their models often identify value in underdog away sides that face shorter hauls compared to their opponents.
Understanding Core Travel Metrics in League Contexts
League play generates predictable travel demands because fixtures follow fixed calendars, allowing analysts to calculate exact distances between venues using standard mapping tools. Data from North American professional circuits indicates that average away trips in basketball reach 1,200 miles per game during conference play, while European soccer leagues average closer to 300 miles but spike during cup ties. Researchers at institutions like the University of Queensland have documented how cumulative fatigue from back-to-back long hauls compounds over a season, producing drops in sprint frequency that reach 8 percent after three consecutive road games exceeding 400 miles each. Those who track these patterns find the metrics integrate cleanly with existing stats such as rest days and altitude changes, creating layered models that refine away team probability estimates without relying on subjective scouting notes.
Performance Correlations Across Different Sports
Evidence from longitudinal reviews shows travel distance correlates with reduced win rates for away teams in multiple codes, though the strength of that link varies by sport and season phase. In basketball, for instance, teams traveling over 800 miles post a 4.2 percent lower field goal percentage on average according to aggregated league data, while soccer sides facing similar distances concede 12 percent more shots from distance in the opening 30 minutes. The Australian Institute of Sport published findings in 2025 that tied jet-lag effects from transcontinental flights to slower reaction times in decision-making drills, and these observations translate directly to betting markets where away totals often drift lower when distance thresholds are crossed. What's interesting is how midweek fixtures in October 2026 amplify these effects because recovery windows shrink to under 48 hours for several clubs simultaneously.
Case Examples from Recent Seasons
One notable instance occurred during the 2025-26 NBA campaign when a Western Conference team logged four road games within nine days covering 3,400 miles total, resulting in a 1-3 record that deviated sharply from their home form. Similar patterns surfaced in English Championship soccer where northern clubs traveling south for double-headers posted lower expected goal tallies, with analysts attributing part of the shortfall to recovery demands rather than squad quality alone. Those reviewing betting archives note that odds compilers have adjusted lines in response, yet discrepancies persist when distance metrics are layered onto fatigue indicators, creating pockets where away underdogs carry positive expected value at standard market prices.

Integrating Metrics into Betting Frameworks
Bettors construct distance-weighted models by pulling fixture lists from official league sources, then applying simple formulas that flag away sides whose cumulative travel exceeds league averages by 20 percent or more. Canadian regulatory bodies overseeing sports integrity have highlighted the value of transparent data sources in such analyses, and parallel work from the European Gaming and Betting Association underscores how objective travel logs reduce reliance on anecdotal injury reports. In practice, this approach surfaces opportunities in league play where shorter-travel away teams outperform implied probabilities, particularly in divisions with uneven geographic spreads. October 2026 fixtures already show several instances where cross-country NBA matchups create measurable edges once rest and travel variables are combined.
Limitations and Refinement Needs
While distance metrics add precision, they function best alongside variables such as time zone shifts, hotel quality records, and opponent-specific defensive styles, because isolated mileage figures overlook individual player adaptation rates. Research from the Norwegian School of Sport Sciences demonstrates that elite athletes sometimes mitigate travel effects through targeted recovery protocols, which means blanket applications of distance thresholds can overstate disadvantages for well-resourced clubs. Analysts therefore refine thresholds seasonally, testing models against historical box scores to calibrate alerts that flag only the most pronounced mismatches. The result is a narrower but more reliable set of away team betting candidates that hold up across different league environments.
Conclusion
Travel distance metrics supply a measurable, replicable input for evaluating away team prospects in league play, with available datasets supporting their inclusion in probability models across soccer and basketball. As schedules intensify through late 2026, the ability to quantify mileage impacts offers a concrete method for identifying where market lines diverge from adjusted performance baselines, and continued data collection from academic and league partners should further sharpen these applications in coming seasons.