High Ground Realities: Tracking How Thin Air Alters Endurance Stats at Mountain Sports Hubs
Riley Richter · Jul 22, 2026
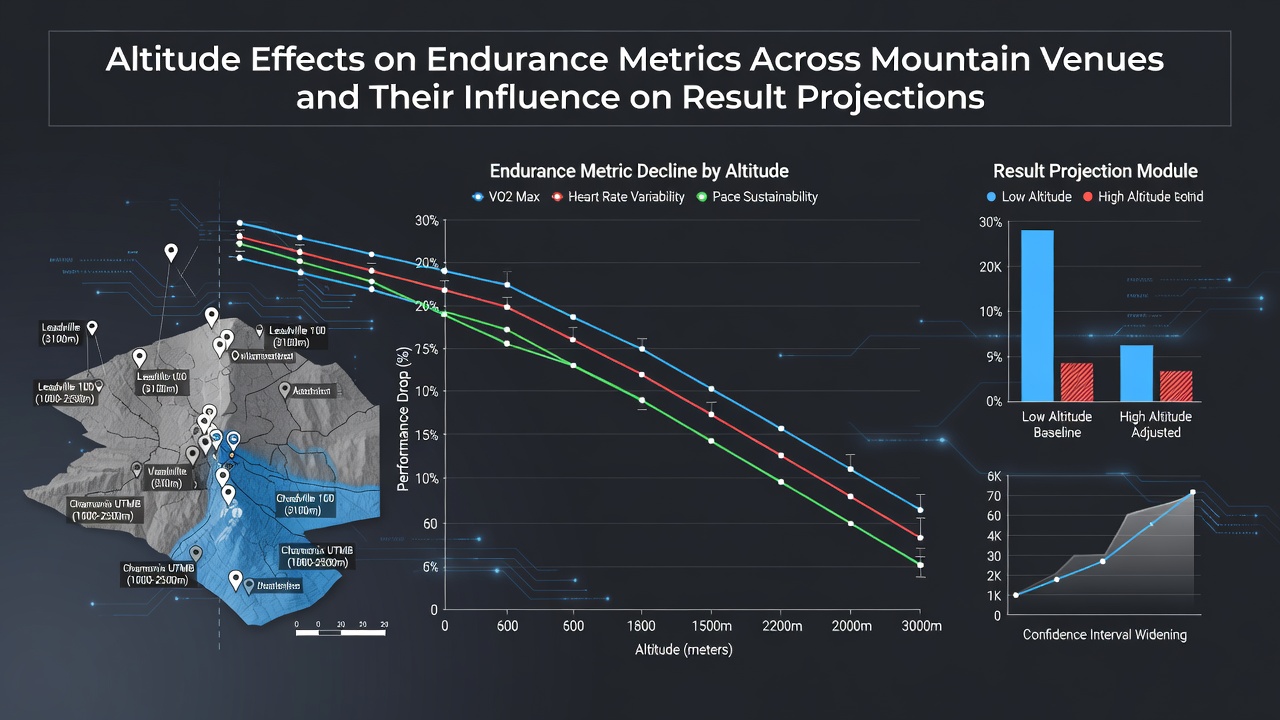
High Ground Realities: Tracking How Thin Air Alters Endurance Stats at Mountain Sports Hubs
Competitors at elevation face immediate drops in oxygen availability that reshape every endurance metric from the first stride onward, and observers note how these changes ripple through performance data across venues like the Alps, the Andes, and the Rockies. Studies from the University of Colorado Boulder highlight that VO2 max declines roughly 7 to 10 percent for every 1,000 meters gained above sea level, while heart rates climb faster and lactate thresholds shift earlier in efforts. Those patterns hold steady whether the event is a cycling stage or a trail run, and analysts use the figures to recalibrate projections before lines move.
Core Physiological Shifts at Altitude
Red blood cell production ramps up over days of exposure, yet acute responses dominate short events and create measurable gaps between sea-level baselines and mountain results. Researchers tracking athletes at 2,500 meters report average power output falling 15 to 20 percent on sustained climbs, while recovery intervals stretch longer between repeated surges. Data collected during events in July 2026 at venues above 2,000 meters showed similar compression in finishing spreads, with mid-pack times stretching by several minutes compared to equivalent flat courses.
Venues differ in how quickly the effects compound. Mexico City sits near 2,240 meters and produces consistent drops in distance-running times, whereas Andean stages topping 3,500 meters amplify the same variables further. European races through the Pyrenees and Dolomites sit lower on average yet feature repeated climbs that compound fatigue across multi-hour efforts. Projection models incorporate these gradients by weighting cumulative elevation gain alongside absolute height, adn betting markets adjust totals and head-to-head lines accordingly.
Venue-Specific Data Patterns
Long-term records from the Tour de France mountain stages reveal that overall race winners post slower average speeds on high-altitude days even when total distance stays comparable to flat stages. Similar trends appear in ultra-trail events across the Sierra Nevada and the Australian Alps, where finish rates drop and time gaps widen among top contenders. Analysts cross-reference these figures with live weather data because temperature and humidity interact with lower air density to alter cooling rates and perceived effort.
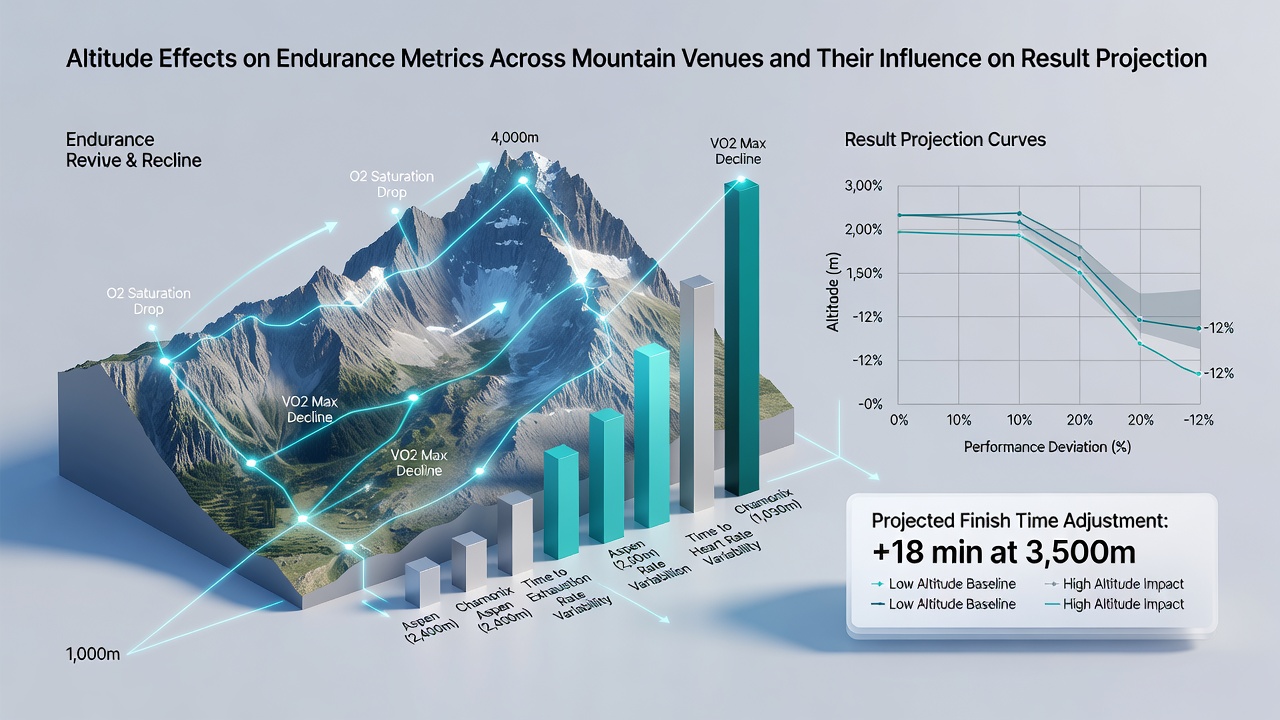
One study released through the Australian Institute of Sport compared identical training blocks performed at sea level and at 1,800 meters; participants showed elevated resting heart rates and reduced time-to-exhaustion on graded treadmills at the higher site. Those who acclimatized for 10 to 14 days narrowed the performance gap but still recorded 5 to 8 percent slower outputs on key endurance tests. Projection algorithms now embed acclimatization windows as variables when forecasting outcomes for athletes traveling from low-lying training bases.
Adjusting Result Projections
Model builders integrate altitude coefficients into regression equations that predict finishing times and margin-of-victory ranges. Input fields include prior performances at comparable elevations, days spent on site, and event-specific elevation profiles. Markets that overlook these inputs often list inflated totals or mispriced individual matchups until sharper money corrects the lines. Figures from multiple seasons indicate that events held above 2,000 meters produce higher variance in results, widening the range of probable outcomes that oddsmakers must price.
Event organizers in July 2026 released updated course data for several mountain marathons and cycling classics, prompting quick recalibrations among those projecting results. The adjustments reflect both the raw physiological cost and the tactical ripple effects, such as reduced breakaway success rates when oxygen debt accumulates faster. Historical data sets from governing bodies like the Union Cycliste Internationale supply the benchmarks that keep these models grounded in observed outcomes rather than estimates.
Case Examples Across Disciplines
Trail-running circuits in the Dolomites post elevation-adjusted course records that sit several minutes slower than sea-level equivalents of the same distance. Cycling time trials at altitude show power-to-weight ratios mattering more than raw wattage, shifting selection criteria for teams. Cross-country skiers training at altitude camps record parallel drops in sustained efforts, and federations publish the aggregated data for coaches and analysts alike. Each discipline supplies its own coefficients that projection systems blend when multiple sports share calendar windows.
Conclusion
Altitude layers measurable constraints onto endurance metrics that flow directly into adjusted performance forecasts across mountain venues. Data sets from universities, sports institutes, and event organizers supply the inputs that keep projections aligned with real-world outcomes. As schedules continue to feature high-elevation stages and races, those monitoring the numbers maintain updated coefficients to reflect both acute responses and longer acclimatization effects.