Rest Recovery Patterns Shaping Outcomes in League Play and Field Events
Rafael Powell · Jul 15, 2026
Rest Recovery Patterns Shaping Outcomes in League Play and Field Events
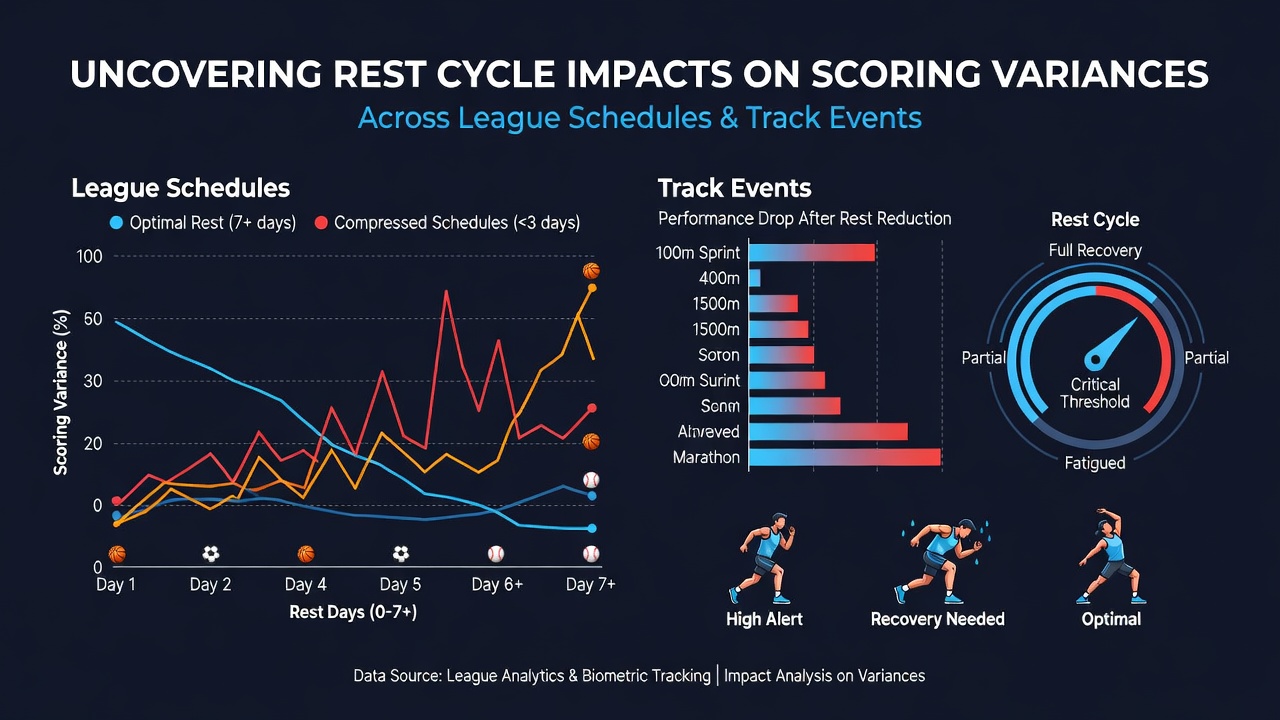
Researchers have examined how rest intervals between matches and events create measurable differences in scoring outputs across major leagues and track competitions, with schedules in 2026 highlighting these patterns through packed calendars that leave limited recovery windows. Data from professional basketball and soccer leagues shows teams playing with fewer than 48 hours between fixtures often post lower offensive totals while defensive metrics fluctuate based on accumulated fatigue. Track athletes face similar constraints during multi-day meets where heats and finals cluster closely together.
League Schedule Structures and Recovery Windows
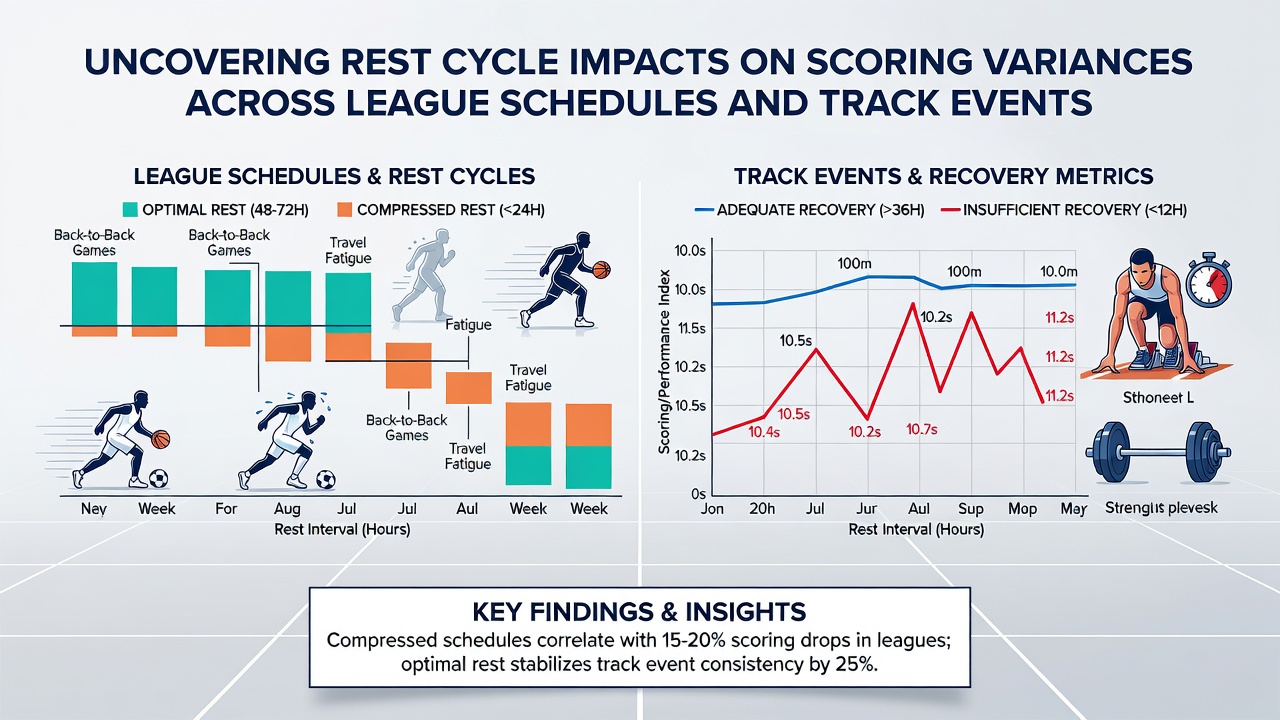
Professional leagues design calendars that sometimes compress games into short periods, and analysts track how those choices correlate with point production. In basketball, back-to-back games produce average scoring drops of 4 to 7 points per team according to season-long datasets, while soccer matches separated by less than three days show reduced goal tallies in the second fixture. Observers note these variances appear consistently across multiple seasons because muscle repair and cognitive sharpness require specific durations that tight schedules interrupt.
Coaches adjust rotations and training loads when rest cycles shorten, yet statistical models still capture residual effects on shooting percentages and sprint distances. One study of European football schedules found that clubs with midweek European commitments scored 12 percent fewer goals in subsequent domestic league games compared with teams that enjoyed full weeks between matches. Those patterns hold after controlling for opponent strength and travel distance.
Track Events and Multi-Round Demands
Track and field competitions present distinct recovery challenges because athletes often compete in preliminary rounds, semifinals, and finals within 24 to 48 hours. Sprint events show measurable declines in reaction times and top-end speed when recovery falls below 36 hours, while endurance disciplines exhibit larger variances in split times. Researchers tracking elite meets report that 400-meter runners who race twice on consecutive days post average times 0.8 seconds slower in the second outing.
Field events such as long jump and shot put display parallel trends, with performance metrics dropping when athletes handle multiple disciplines on the same day. Data collected at major championships indicates that throwers competing in both qualifying and final rounds on the same afternoon achieve distances 3 to 5 percent shorter than those with overnight separation. These differences accumulate across a meet schedule and influence medal distributions.
Quantifying Scoring Variances Through Data
Statistical agencies compile play-by-play and timing data that allow direct comparison of performance across different rest intervals. League operators release these figures annually, and independent researchers apply regression models to isolate rest as a variable. Results consistently show elevated variance in scoring when rest drops below league averages, with standard deviations increasing by up to 15 percent in compressed windows.
July 2026 schedules across several North American and European leagues feature dense stretches that analysts flag in advance. Teams and athletes prepare contingency plans around those dates because historical records demonstrate elevated injury rates and altered output distributions during similar clusters. Performance tracking platforms now integrate rest-cycle algorithms into pre-match projections.
Physiological Mechanisms Behind the Patterns
Sports science literature identifies sleep architecture, glycogen replenishment, and neuromuscular fatigue as primary drivers of the observed variances. When rest intervals shorten, athletes accumulate micro-damage that affects power output and decision-making speed. Studies using wearable sensors record lower peak force production and slower recovery heart rates in athletes who compete with reduced downtime.
Nutrition and active recovery protocols can partially offset these effects, yet complete mitigation remains difficult under tournament conditions. Research from Canadian university labs and Australian sports institutes demonstrates that even optimized interventions leave residual performance gaps when total sleep time falls below seven hours across consecutive nights. These gaps translate directly into measurable scoring differences at the professional level.
Comparative Analysis Across Sports
Team sports and individual track events share core physiological responses to rest deficits while differing in how those responses manifest in final scores. Basketball and soccer produce collective scoring totals influenced by multiple players' recovery states, whereas track events isolate individual variances more cleanly. Both categories nevertheless display statistically significant shifts once rest drops below sport-specific thresholds.
Cross-sport datasets compiled by international federations reveal that events requiring repeated high-intensity efforts suffer larger percentage drops than those relying on skill execution under lower physical loads. Analysts use these comparisons to refine scheduling recommendations and to inform athlete management strategies during congested periods.
Conclusion
Rest cycle analysis supplies concrete metrics that explain scoring fluctuations across league schedules and track competitions. Organizations continue to refine calendars using these insights while athletes and support staff implement targeted recovery interventions. The patterns documented through league data and meet timing records remain consistent across seasons and geographies, offering a factual basis for understanding performance variability.